Announces Record Resource Estimate at the San Jose Mine in Argentina
Toronto, Mar 19, 2013 AEST (ABN Newswire) - McEwen Mining Inc. ( NYSE:MUX)(TSE:MUX) is pleased to announce that year-end 2012 mineral resource and reserve estimates and the grades for both gold and silver have increased from 2011 for the San Jose mine (49% owned by McEwen Mining). Of particular interest, the mineral resource estimates have increased to a record level. The mineral reserve and resource estimates were calculated using US$1,200 per ounce gold and US$20 per ounce silver. The estimates were independently audited by P&E Mining Consultants Inc.
San Jose Mine Resources & Reserves Highlights (100% Basis)
-- Inferred gold and silver resources up 61% and 44%, respectively, to 497,400 ounces gold and 32.1 million ounces silver, contained in 2.1 million tonnes. Gold grades increased by 39% to 7.37 gpt and silver grades increased by 24% to 476 gpt.
-- Proven and Probable gold and silver reserves up 7% and 20% respectively, to 367,100 ounces gold and 26.8 million ounces silver, contained in 1.8 million tonnes. Gold grades increased by 1% to 6.44 gpt and silver grades increased by 14% to 470 gpt.
-- Measured and Indicated gold silver resources down 5% to 991,200 ounces gold while silver resources decreased marginally to 68.3 million ounces silver, contained in 4.4 million tonnes. Gold grades increased by 1% to 7.03 gpt and silver grades increased by 6% to 484 gpt.
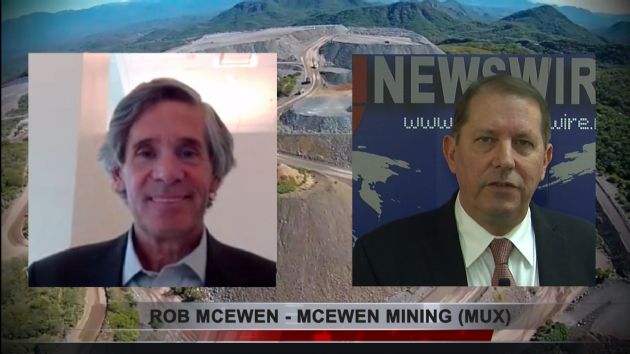
"San Jose is a world class mine that continues to get better with each passing year. I would like to congratulate the team at the mine and our partners, Hochschild Mining Plc, for conducting a very successful exploration program in 2012," stated Rob McEwen, Chief Owner.
SAN JOSE MINE - BIGGER & HIGHER GRADE!
The San Jose mine is one of the highest-grade precious metal mines in the Americas. In 2012, more than 84,000 ounces of gold and 5.85 million ounces of silver were extracted, which was a new record for the mine (see Figure 3). Production attributable to McEwen Mining for 2012 was 48,876 ounces of gold and 2.92 million ounces of silver. Net of this production, total reserves increased by 7% for gold and 20% for silver, to an estimated 1.8 million tonnes at a grade of 6.44 gpt gold and 470 gpt silver, for a total of 367,100 ounces of gold and 26.8 million ounces of silver.
In addition to replacing reserves, the exploration program in 2012 was focused on identifying new veins and also extensions of current zones. With the largest exploration program in the mine's history, Inferred resources were expanded by 61% for gold and 44% for silver versus 2011. It is also important to note that the grade of the Inferred resources has materially increased by 39% for gold and 24% for silver. Inferred resources now total 2.1 million tonnes at a grade of 7.37 gpt gold and 476 gpt silver, for a total of 497,400 ounces of gold and 32.1 million ounces of silver.
Measured and Indicated resources were down slightly versus 2011. The reason for the decrease was due to drilling being focused on resource expansion rather than infill for resource upgrading. Measured and Indicated resource categories now total 4.4 million tonnes at a grade of 7.03 gpt gold and 484 gpt silver, for a total of 991,200 ounces of gold and 68.3 million ounces of silver.
The San Jose mine is owned and operated by Minera Santa Cruz S.A., a joint venture owned 51% by Hochschild Mining Plc and 49% by McEwen Mining Inc.
EXPLORATION IN 2013
The 2013 exploration budget for the San Jose mine is US$8 million. The goal is to complete 39,250 meters of diamond drilling. The majority of this drilling will be targeting new resources located south-east of the mine area. The balance of the drilling will be for infill drilling designed to convert a portion of the Inferred resources to the Measured and Indicated resource categories.
Table 1- Audited San Jose Mineral Resource Estimate, December 31, 2012
---------------------------------------------------------------------------- Tonnes Au Ag Au AgCategory (000's) (g/t) (g/t) (K oz) (M oz)----------------------------------------------------------------------------Measured 1,289 8.15 559 337.8 23.17----------------------------------------------------------------------------Indicated 3,098 6.56 453 653.4 45.12----------------------------------------------------------------------------Measured and Indicated 4,387 7.03 484 991.2 68.29----------------------------------------------------------------------------Inferred 2,099 7.37 476 497.4 32.12----------------------------------------------------------------------------Notes: 1. Represents 100% of the resources. McEwen Mining Inc. has a 49% attributable interest in the San Jose property. 2. Mineral resources, which are not mineral reserves, do not have demonstrated economic viability. 3. Mineral resources are reported inclusive of mineral reserves. 4. The quantity and grade of reported Inferred resources are uncertain in nature and there has been insufficient exploration to classify these Inferred resources as Measured or Indicated, and it is uncertain if further exploration will result in upgrading them to an Indicated or Measured category. 5. Mineral Resources were estimated by Hochschild Mining Plc using the CIM Standards on Mineral Resources and Reserves, Definitions and Guidelines prepared by the CIM Standing Committee on Reserve Definitions. P&E Mining Consultants Inc have audited the resource estimates and found that they meet both the requirements for Canadian disclosure under NI 43-101 and the Joint Ore Reserves Committee of the Australian Institute of Mining and Metallurgy ("JORC"). 6. Resource estimations utilized inverse distance and ordinary kirging methods depending upon data density. 7. Metal prices used were $1200/oz for Au and $20/oz for Ag. 8. Resources were defined at a cut-off grade of 213 g/t AgEq, which is equivalent to a cut-off value of $92.88/tonne. The cut-off value was increased from $88.31/tonne used for the December 31, 2011 estimate reflecting higher operating costs due to local inflation. Table 2- Audited Mineral Reserve Estimate, December 31, 2012 ---------------------------------------------------------------------------- Tonnes Au Ag Au AgCategory (000's) (g/t) (g/t) (K oz) (M oz)----------------------------------------------------------------------------Proven 830 6.73 470 179.6 12.54----------------------------------------------------------------------------Probable 942 6.19 471 187.5 14.26----------------------------------------------------------------------------Proven and Probable 1,772 6.44 470 367.1 26.80----------------------------------------------------------------------------Notes: 1. Represents 100% of the reserves. McEwen Mining Inc. has a 49% attributable interest in the San Jose property. 2. Metal prices used were $1200/oz for Au and $20/oz for Ag (same as for resources). 3. Reserves were defined at a cut-off $92.88/tonne, which is the same cutoff value used for resources. The cut-off value is based on historical January to November 2012 geologic, mining, plant and mine administration variable and fixed cost, and December 2012 estimated costs. P&E considers these costs to reasonable as a basis for estimating mineral reserves. 4. Average internal dilution was 8%. Average mining and geotechnical dilution was 27%. 5. Mineral Reserves were estimated by Hochschild Mining Plc using the CIM Standards on Mineral Resources and Reserves, Definitions and Guidelines prepared by the CIM Standing Committee on Reserve Definitions. P&E Mining Consultants Inc have audited the reserve estimates and found that they meet the requirements for disclosure as reserves under NI 43-101 and the Joint Ore Reserves Committee of the Australian Institute of Mining and Metallurgy ("JORC") as well as the US Securities and Exchange Commission Industry Guide 7. Table 3 - Comparison of San Jose Mine Reserve Estimates (100% Basis) December 31, 2012 Reserve Estimate -------------------------------------------------------------- Tonnes(000 Au Ag Au AgCategory 's) (g/t) (g/t) (K oz) (M oz)--------------------------------------------------------------Proven 830 6.73 470 179.6 12.54--------------------------------------------------------------Probable 942 6.19 471 187.5 14.26--------------------------------------------------------------Proven & Probable 1,772 6.44 470 367.1 26.80--------------------------------------------------------------December 31, 2011 Reserve Estimate ----------------------------------------------------------- Tonnes Au Ag Au AgCategory (000's) (g/t) (g/t) (K oz) (M oz)-----------------------------------------------------------Proven 805 6.99 475 181 12.29-----------------------------------------------------------Probable 876 5.79 354 163 9.97-----------------------------------------------------------Proven & Probable 1,681 6.36 412 344 22.26----------------------------------------------------------- Table 4 - Comparison of San Jose Mine Resource Estimates (100% Basis) December 31, 2012 Resource Estimate ------------------------------------------------------------ Tonnes Au Ag Au AgCategory (000's) (g/t) (g/t) (K oz) (M oz)------------------------------------------------------------Measured 1,289 8.15 559 337.8 23.17------------------------------------------------------------Indicated 3,098 6.56 453 653.4 45.12------------------------------------------------------------Measured & Indicated 4,387 7.03 484 991.2 68.29------------------------------------------------------------Inferred 2,099 7.37 476 497.4 32.12------------------------------------------------------------December 31, 2011 Resource Estimate ------------------------------------------------------------ Tonnes Ag Au Au AgCategory (000's) (g/t) (g/t) (K oz) (M oz)------------------------------------------------------------Measured 1,155 8.21 560 305 20.80------------------------------------------------------------Indicated 3,513 6.53 423 738 47.78------------------------------------------------------------Measured & Indicated 4,668 6.95 457 1043 68.58------------------------------------------------------------Inferred 1,813 5.30 384 309 22.38------------------------------------------------------------
RELIABILITY OF INFORMATION
Minera Santa Cruz S.A., the owner of the San Jose mine, is responsible for and has supplied to the Company all reported results from the San Jose mine. McEwen Mining's joint venture partner, a subsidiary of Hochschild Mining plc, and its affiliates other than MSC do not accept responsibility for the use of project data or the adequacy or accuracy of this release. Although the Company has independently verified reserve and resource estimates, as the Company is not the operator of the San Jose mine, there can be no assurance that production information reported to the Company by MSC is accurate, the Company has not independently verified such information and readers are therefore cautioned regarding the extent to which they should rely upon such information.
TECHNICAL INFORMATION
The technical content of this news release has been reviewed and approved by Eugene Puritch, P. Eng., President of P&E Mining Consultants Inc. Under the direction of Mr. Puritch, Al Hayden, P. Eng., James L. Pearson, P. Eng., and Fred H. Brown, CPG, P.Geo. performed an independent audit of the December 31, 2012 resource and reserve estimates. Each of the foregoing is a Qualified Person and independent of the Corporation, in each case, within the meaning of Canadian National Instrument 43-101 (NI 43-101). Each of the Qualified Persons visited the site on February 23rd and 24th, 2013, where resource modeling techniques were reviewed, the drill hole database was inspected and independent drill core samples were collected for verification of Au and Ag grades. Site visit data review and sampling revealed no issues of concern regarding the resource estimate. For additional information about the San Jose Mine, see the technical report dated August 15, 2012 titled "Technical Report on the San Jose Silver-Gold Mine, Santa Cruz, Argentina" prepared by Eugene J. Puritch, P.Eng., Alfred S. Hayden, P.Eng., James L. Pearson, P.Eng, Fred H. Brown, CPG, P.Geo., and David Burga, P.Geo. all of P&E Mining Consultants Inc. and each a "Qualified Person" and "independent" of McEwen Mining, in each case, within the meaning of NI 43-101.
The foregoing news release and technical report are available under the Corporation's profile on SEDAR (www.sedar.com).
CAUTIONARY NOTE TO US INVESTORS
McEwen Mining prepares its resource estimates in accordance with standards of the Canadian Institute of Mining, Metallurgy and Petroleum referred to in Canadian National Instrument 43-101 (NI 43-101). These standards are different from the standards generally permitted in reports filed with the SEC. Under NI 43-101, McEwen Mining reports measured, indicated and inferred resources, measurements, which are generally not permitted in filings made with the SEC. The estimation of measured resources and indicated resources involve greater uncertainty as to their existence and economic feasibility than the estimation of proven and probable reserves. U.S. investors are cautioned not to assume that any part of measured or indicated resources will ever be converted into economically mineable reserves. The estimation of inferred resources involves far greater uncertainty as to their existence and economic viability than the estimation of other categories of resources.
CAUTION CONCERNING FORWARD-LOOKING STATEMENTS
This press release contains certain forward-looking statements and information, including "forward-looking statements" within the meaning of the Private Securities Litigation Reform Act of 1995. The forward-looking statements and information expressed, as at the date of this press release, McEwen Mining Inc.'s (the "Company") estimates, forecasts, projections, expectations or beliefs as to future events and results. Forward-looking statements and information are necessarily based upon a number of estimates and assumptions that, while considered reasonable by management, are inherently subject to significant business, economic, political and competitive uncertainties, risks and contingencies, and there can be no assurance that such statements and information will prove to be accurate. Therefore, actual results and future events could differ materially from those anticipated in such statements and information. Risks and uncertainties that could cause results or future events to differ materially from current expectations expressed or implied by the forward-looking statements and information include, but are not limited to, risks related to the cost of transferring or otherwise allocating funds between operating jurisdictions, factors associated with fluctuations in the market price of precious metals, mining industry risks, political, economic, social and security risks associated with foreign operations, risks associated with the construction and permitting of mining operations and commencement of production and the projected costs thereof, risks related to litigation, property title, the state of the capital markets, environmental risks and hazards, uncertainty as to calculation of mineral resources and reserves and other risks. Readers should not place undue reliance on forward-looking statements or information included herein, which speak only as of the date hereof. The Company undertakes no obligation to reissue or update forward-looking statements or information as a result of new information or events after the date hereof except as may be required by law. See McEwen Mining's Annual Report on Form 10-K for the fiscal year ended December 31, 2012 and other filings with the Securities and Exchange Commission, under the caption "Risk Factors", for additional information on risks, uncertainties and other factors relating to the forward-looking statements and information regarding the Company. All forward-looking statements and information made in this news release are qualified by this cautionary statement.
The NYSE and TSX have not reviewed and do not accept responsibility for the adequacy or accuracy of the contents of this news release, which has been prepared by management of McEwen Mining Inc.
About McEwen Mining Inc

McEwen Mining (NYSE:MUX) (TSE:MUX) has the goal to qualify for inclusion in the S&P 500 Index by creating a profitable gold and silver producer focused in the Americas. McEwen's principal assets consist of: the San José mine in Santa Cruz, Argentina (49% interest); the Black Fox mine in Timmins, Canada; the Fenix Project in Mexico; the Gold Bar mine in Nevada, currently under construction; and the large Los Azules copper project in Argentina, advancing towards development.
McEwen has approximately 345 million shares outstanding. Rob McEwen, Chairman and Chief Owner, owns roughly 23% of the shares.
![]()
![]()
![]()
![]()
| ||
|