
April 2015 Result - CleanTech Rides Buoyant Chinese Shares
Sydney, May 11, 2015 AEST (ABN Newswire) - The China CleanTech Index recorded a 16.1% gain in April 2015 significantly outperforming three its benchmarks but still behind the overall Chinese market.
The China CleanTech Index rose from 64.25 to 74.57 over the month of April recording a 16.1% gain. This compared to the NEX gain of 5.1%, the CTIUS gain of 1.1%, the Shanghai Composite gain of 18.5% and the MSCI gain of 2.2%.
The China CleanTech 20 recorded a better gain of 19.7% over the month.
The best performing sub-indices for the month were the China Hydro Index with a 38.4% gain and the China Storage Index with a 17.1% gain. The two weakest sub-indices through April were the China Environment Index with 9.9% gain and the China Solar Index with a 7.4% gain.
--------------------------------------------------------------- 2012 2013 2014 04-2015 3m 6m 12m 3y---------------------------------------------------------------(CCTI) -16.5% 29.2% 18.8% 16.1% 40.0% 53.5% 76.7% 79.2%(CCT20) -15.5% 24.1% 18.2% 19.7% 39.5% 62.9% 80.6% 63.8%(NEX) -5.5% 53.7% -3.2% 5.1% 16.5% 7.0% 3.6% 61.4%(CTIUS) 7.3% 37.0% -8.4% 1.1% 9.1% 4.9% -4.1% 33.5%(SHCOMP) 3.2% -6.7% 52.8% 18.5% 38.4% 83.5% 119.2% 85.3%(MSCI) 13.2% 24.1% 2.9% 2.2% 6.0% 4.1% 5.4% 37.4%---------------------------------------------------------------
CCTI - China CleanTech Index
CCT20 - China CleanTech 20
NEX - Wilder Hill New Energy Global Innovation Index
CTIUS - Cleantech Index
SHCOMP - China Shanghai Composite Index
MSCI - MSCI World
The market capitalisation of the 167 stocks in the China CleanTech Index is CNY 2.2 trillion (US$357 billion), up a long way from its trough of CNY 604 billion in November 2012.
The month's performance was driven by 17 companies having share price gains of more than 35%. The greatest percentage gains were recorded by Power Construction Corporation of China Ltd (previously Sinohydro Group Ltd) (601669.SS), China Industrial Waste Management Inc (CIWT) and Cofco Biochemical (Anhui) (000930.SZ)
These were partially offset by losses from other companies with only 8 companies having losses of more than 10%. The greatest percentage losses were recorded by Jiangxi Sanchuan Water Meter Co Ltd (300066.SS), Nanjing CEC Environmental Protection Co., Ltd (300172.SZ) and China Energy Recovery Inc (CGYV).
These best and worst performers are shown in the table below.
April 2015
Best Performers
Share Price Gain > 35%
Cofco Biochemical (Anhui) ( SHE:000930)
China Clean Energy (CCGY:OTCMKTS)
Guangzhou Hongli Opto Electronic (SHE:300219)
RINO International Corporation (RINO:OTCMKTS)
Suntech Power Holdings (NYSE:STP)
Beijing Easpring Material Technology (SHE:300073)
Chaowei Power Holdings (HKG:0951)
Hunan Corun New Energy (SHA:600478)
Tianneng Power International (HKG:0819)
China Industrial Waste Management (CIWT:OTCMKTS)
Sound Environmental Resources (SHE:000826)
Shenzhen Dongjiang Environmental (HKG:0895)
Zhejiang Reclaim Construction Group (SHE:002586)
Power Construction Corporation of China (SHE:601669)
China Energine International (HKG:1185)
China Ming Yang Wind Power (NYSE:MY)
China Power New Energy Development (HKG:0735)
Worst Performers
Share Price Loss > 10%
China Energy Recovery (CGYV:OTCMKTS)
Shanghai Yanhua Smartech (SHE:002178)
E-Ton Solar Tech (TWE:3452)
LDK Solar (NYSE:LDK)
Advanced Battery Technologies (ABAT:OTCMKTS)
Jiangsu Welle Environmetnal (SHE:300190)
Jiangxi Sanchuan Water Meter (SHA:300066)
Nanjing CEC Environmental Protection (SHE:300172)
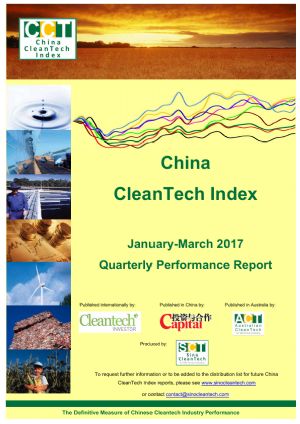
The China Cleantech Index is updated each month and published on the SinoCleantech website at www.sinocleantech.com. It is published internationally in conjunction with Cleantech Investor (www.cleantechinvestor.com) and in China in conjunction with Top Capital (www.topcapital.cn).
Monthly results can be emailed directly to interested parties by signing up to the distribution list at:
http://www.sinocleantech.com/e/cleantech_index.html
About Sino CleanTech
 Sino CleanTech publishes the China CleanTech Index and facilitates Chinese Cleantech investments and provides services to Government agencies across Asia to help stimulate investment in the Cleantech industry. These investments include looking at listed cleantech stocks and direct investment into projects and companies. Sino Cleantech is active in facilitating:
- Investment from Chinese investors into cleantech in both China and internationally; and
- Investment from international investors into the Chinese cleantech market.
Please contact us if you are looking for funding or seeking investments.
![]()
| ||
|
Zhejiang Reclaim Construction Group 


Tianneng Power International Limited
Suntech Power Holdings Co., Ltd. 


Sound Environmental Resources Co Ltd
Sino CleanTech
Shanghai Yanhua Smartech Group Co Ltd
RINO International Corporation
Power Construction Corporation of China
Nanjing CEC Environmental Protection Co., Ltd
LDK Solar Co., Ltd
Jiangxi Sanchuan Water Meter CO., LTD.
Jiangsu Welle Environmental Co Ltd
Hunan Corun New Energy Co., Ltd.
Guangzhou Hongli Opto Electronic Co Ltd
E-Ton Solar Tech
Dongjiang Environmental Co Ltd
Cofco Biochemical Anhui Co Ltd
China Power New Energy Development Co., Ltd
China Ming Yang Wind Power Group Ltd
China Industrial Waste Management Inc.
China Energy Recovery Inc.
China Clean Energy Inc.
Chaowei Power Holdings Limited
Beijing Easpring Material Techgy Co Ltd
Advanced Battery Technologies, Inc.
Tianneng Power International Limited
Suntech Power Holdings Co., Ltd.
Sound Environmental Resources Co Ltd
Sino CleanTech
Shanghai Yanhua Smartech Group Co Ltd
RINO International Corporation
Power Construction Corporation of China
Nanjing CEC Environmental Protection Co., Ltd
LDK Solar Co., Ltd
Jiangxi Sanchuan Water Meter CO., LTD.
Jiangsu Welle Environmental Co Ltd
Hunan Corun New Energy Co., Ltd.
Guangzhou Hongli Opto Electronic Co Ltd
E-Ton Solar Tech
Dongjiang Environmental Co Ltd
Cofco Biochemical Anhui Co Ltd
China Power New Energy Development Co., Ltd
China Ming Yang Wind Power Group Ltd
China Industrial Waste Management Inc.
China Energy Recovery Inc.
China Clean Energy Inc.
Chaowei Power Holdings Limited
Beijing Easpring Material Techgy Co Ltd
Advanced Battery Technologies, Inc.